Analysis of pipeline networks using pressure measurements

Pressure measurement campaigns allow us to check whether the theoretical calculations accurately reflect the situation in the field.
When it comes to planning gas and water distribution systems, network calculations are only a reliable decision-making tool if the computer model maps the hydraulic characteristics of the grid as accurately as possible.
Out in the field, things often look quite different. Experience has shown that pipelines can be made of different materials, or that deposits in pipes can cause variations in pipe roughness. Network analyses also show that as-builts held by utilities are not always updated to reflect the status of assets in the field.
Pressure measurement campaigns allow us to check whether the theoretical calculations accurately reflect the situation in the field. That way, network operators acquire meaningful information about the condition and the potential of their gas and water mains.
EXACT MEASUREMENTS – EXACTLY PLANNED
We support you with the preparation, performance and evaluation of pressure measurement campaigns
As part of our services, we will
- prepare an action plan defining the course of events, the measurement points and the installation conditions;
- provide the necessary instrumentation and adapters/connectors free site;
- brief your personnel on how to install/handle the equipment and record data;
- analyse and document the results of the pressure measurement campaign;
- perform a grid analysis/grid model validation.
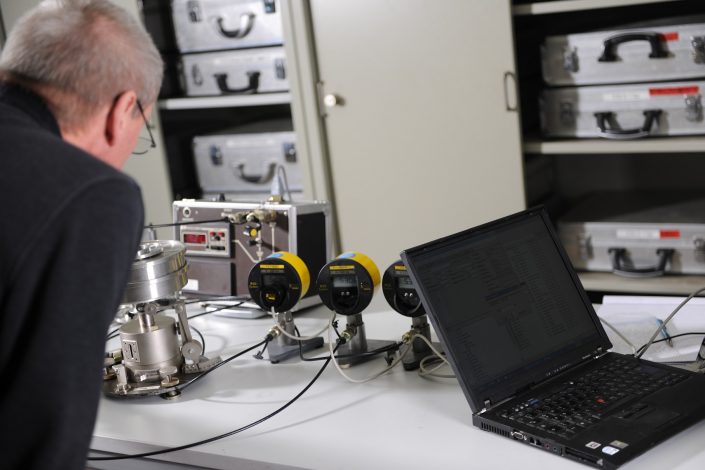
For long-term measurements on gas grids, we can provide up to 250 highly accurate electronic pressure loggers (ESS) designed for different pressure ranges. After some 3 to 4 weeks, we have around 4,000 meaningful readings for each instrument.
For short-term measurements on water grids, the instruments (100 ESS) are temporarily connected to below-ground hydrants using bayonet adapters. In consultation with you we try to ensure that there is as high a grid load as possible while we take our pressure readings (e.g. by withdrawing additional volumes at specific locations).
MEANINGFUL MEASUREMENT RESULTS

We use the data from pressure measurement campaigns for meaningful comparative calculations and trend analyses.
The results of our measurement campaigns are presented in a clear graphic format. In addition, we can provide what is known as a ‘trend analysis’ (for gas) to identify whether the pressure at a particular measuring point is stable across the recorded load range or whether there are pressure fluctuations at high loads. In this way, our campaigns can detect network weaknesses even if there is no computer model.
We can also analyse the results of the measurement campaign and perform systematic comparative calculations for network analysis/grid model validation purposes. So far as possible we will try to establish the cause of any measurement deviations and assess their impact on extreme supply situations.

